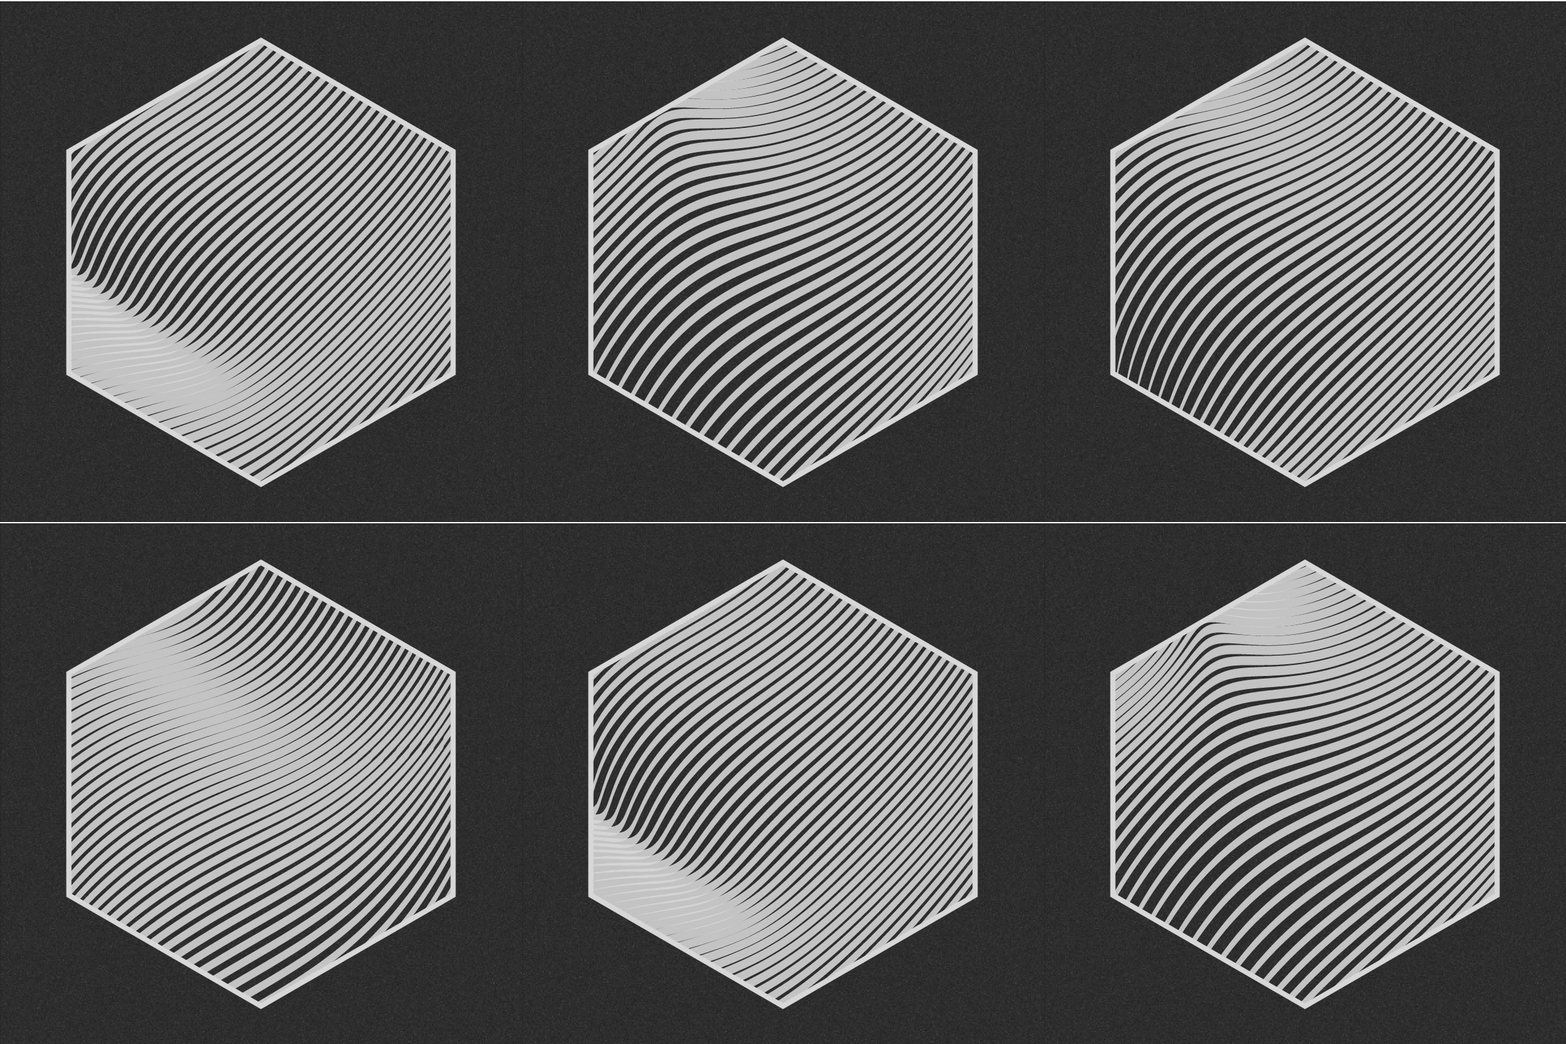
Wavy Hexagon
We learn a lot by reading others’ code. To be honest, both of us (Pine & Anthony) didn’t start compform with a lot of expertise, but we quickly found sketches we like and learned by imitating and remixing. That’s one of the awesome benefits of digital sketches — when the kind-hearted authors share the source code, others can learn and adapt. We took the spirit in Codecember by asking you to share the source code of each sketch if possible.
So last week we found a treasure trove by Lionel Radisson: Observable & creative coding. In this notebook, Lionel meticulously documented his art, his well-crafted utility libraries and his process of iteration. The notebook is phenomenal — we will probably revisit it many times to learn from Lionel. For today, we picked one of Lionel’s sketches to recreate it in p5.js as a process of learning: Wavy Hexagon.

The Task
Although the sketch is available on Observable here, I ported it to p5.js.
I’d like to share a little bit about what I learned from the sketch and how I would deconstruct the sketch to learn from it.
My first step is to reduce the sketch to its bare minimum, which reveals its essence.

This is succinctly captured in this sketch. The important bits are:
let t = 0

function draw() {
  t += 0.01

  const cosT = cos(t * TAU) * 0.15
  const sinT = sin(t * TAU) * 0.15

  ...
      const angle = simplex.noise4D(x / 800, y / 800, cosT, sinT) * TAU
  ...
}
let t = 0
function draw() {
t += 0.01
const cosT = cos(t * TAU) * 0.15
const sinT = sin(t * TAU) * 0.15
...
const angle = simplex.noise4D(x / 800, y / 800, cosT, sinT) * TAU
...
}I’d then tweak the angle a little bit. What if it’s a constant? What if it’s calculated from only x and y, but without t? What if I’m using Perlin noise instead of SimplexNoise?
Once I have a firm understanding of the sketch above, I’d then look into how I could translate it into the Wavy Hexagon. Here are two neat tricks that I have learned:
// by drawing a hexagon and calling this API, the sketch trims its canvas to the hexagon
drawingContext.clip()

// rotate around center instead of around (0, 0)
translate(width / 2, height / 2)
rotate(-PI / 4)
translate(-width / 2, -height / 2)
// by drawing a hexagon and calling this API, the sketch trims its canvas to the hexagon
drawingContext.clip()
// rotate around center instead of around (0, 0)
translate(width / 2, height / 2)
rotate(-PI / 4)
translate(-width / 2, -height / 2)Finally, I’d try to do something new with the sketch. For example, adding some interaction to explore other possibilities or using other noise functions. Here’s a simple sketch that produces different waves as you move your mouse around. It simply maps mouseX to the time-increasing speed and mouseY to the multiplier on cosT and sinT.
function mouseMoved() {
  tDelta = map(mouseX, 0, dim, 0, 0.02)
  trigoMultiplier = map(mouseY, 0, dim, 0.05, 0.3)
}
function mouseMoved() {
tDelta = map(mouseX, 0, dim, 0, 0.02)
trigoMultiplier = map(mouseY, 0, dim, 0.05, 0.3)
}To summarize, here are my steps to learn from other sketches:
- Replicate the essence of the sketch
- Understand its mathematics (which variables are changing, and how? what are the relationships between the variables?)
- Understand each of its API calls (for example, what does
drawingContext.clip()do?) - Reconstruct the sketch
- Remix it with new ideas
Have fun learning, and look forward to what you’ll create!
When you are all done, post your work on Twitter with the hashtag #codecember and #day10. Remember to include a link to the source code, so others can learn from your creation. We look forward to seeing your sketch!
P.S. Sorry for being late. We’ll try to catch up!